ECG delineation analyzer - additional module

This article details how to use the solution software module to perform the ECG delineation.
1. What is the ECG delineation module?
The system provides 3 biosignals: the initial cardiac parameters provided in the software by the ECG analyzer module were based on the detection of the R-peak. Today it is possible to analyze the parameters related to the other peaks P, Q, S and T (events, average pattern, intervals...) of the ECG signal thanks to the ECG delineation analyzer module, called ADVANCED ECG MODULE in the software.
For this, the software will perform an average pattern from the ECG cycles of the raw signal as a mean to filter the noise of the signal and abnormal detections : this average pattern is created by overlapping several signal complexes (60 cycles by default). It results in a smoothed, distinct pattern, on which the events P, Q, S, T peaks are placed and the intervals are calculated.
2. How to perform it in the software ?
A. Module activation
If the delineation module is present on your system, the module is displayed and available in the DETECT CONFIG pop-up window, after clicking on the DETECT button to launch algorithm detection.

By default, the module activation button will be check for Advanced ECG module :
it is also at this moment that you can configure your detection, for example, you can reduce the number of cycles used for the average pattern (Averaging : Beats = 60 cycles ) or choose to make your pattern on a duration (Averaging : Time = 10 sec).
Main default ECG delineation setting :
For more details and access to the list of detection parameters for the ECG advanced module. Please, click here.
All the following parameters can be edited in the DETECT CONFIG window :
Blue box = default visible parameter
White box = parameter visible by checking the “ADVANCED MEASURE MODE” box at the bottom of the DETECT CONFIG page.

The parameters and default values shown above may vary according to software version (here 2.16) and species (here: rat).
Wait a few minutes.... Software processes data :

Once the detection is done you have access to the MERGE withs different delineation module views (  ) and the intervals expressed in ms when exporting (
  ) your data.
The additional views available with the ECG delineation module are described in the following sections.
B. ECG delineation analyzer moduel views
- PQRST Delineation of ECG pattern

This view allows to observe the average pattern from the 60 cycles and visualize the identification of key events (P wave, QRS complex and T wave) by detection algorithms. .
- RR and QT correlation

This view allows to observe correlations between the RR interval and the corrected or uncorrected QT interval.
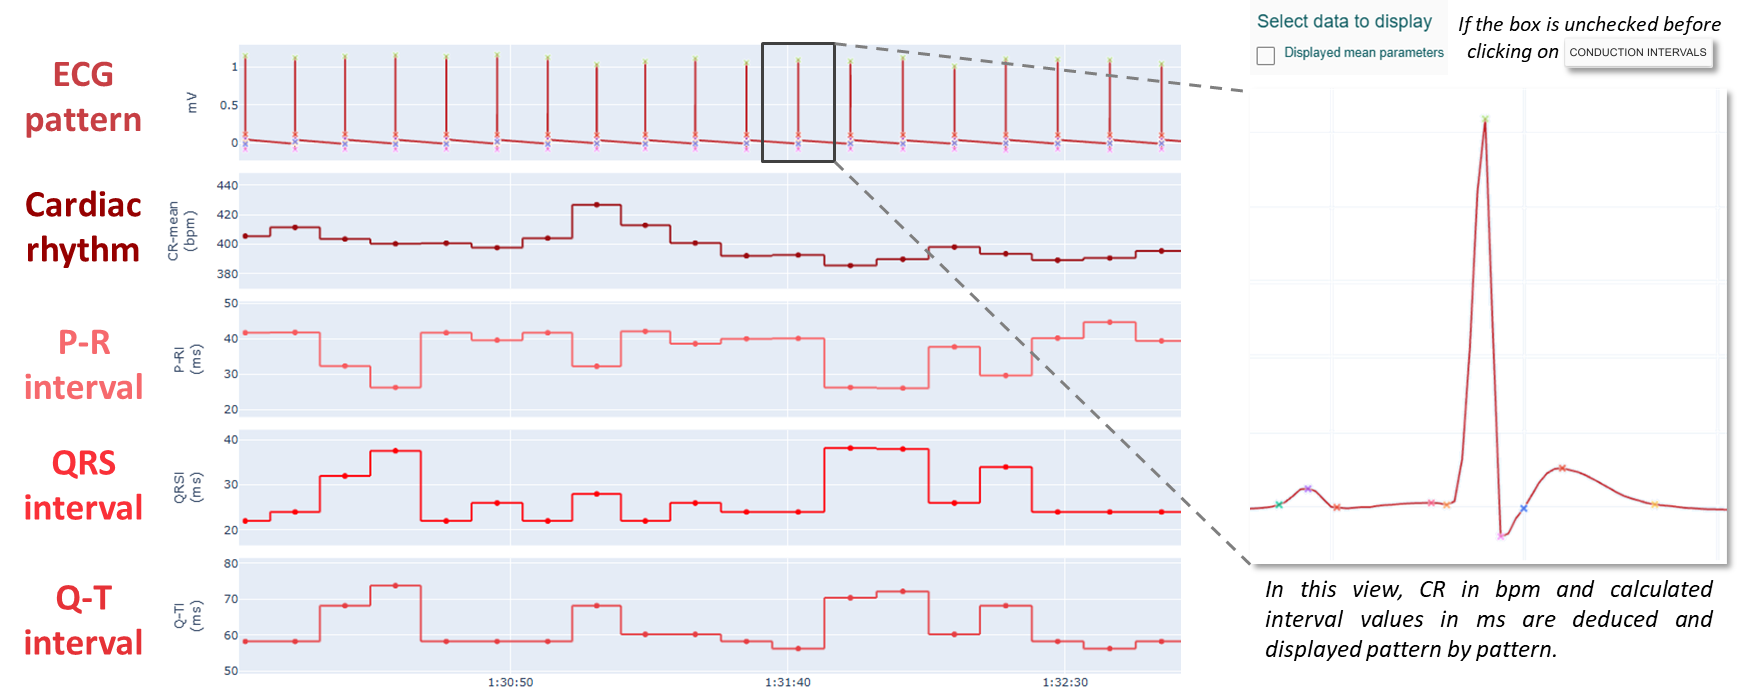
- Calculated conduction intervals of ECG pattern
This view shows the evolution of heart rate and interval values over time.
If you want to display the average pattern and its associated interval values (i.e. a pattern-by-pattern value), you must uncheck the box "Displayed mean parameters" to avoid displaying parameters averaged over 10 seconds (default setting to simplify display of large amounts of data).
- Patterns Waterfall for 3D viewing
This view aligns the patterns (based on the R peaks), to offer a 3D rendering of the evolution of the signal.
3. What are the physiological variables obtained with this module and how are they obtained?
In the Excel export file, the physiological variables of this supplementary module can be found at the end of the column in the sheet, as illustrated below:
Details of how to obtain an excel spreadsheet of data from different acquisition sessions are given here.
For more details and access to the list of List of cardiac delineation parameters provided by the LASA software ECG advanced module. Please, click here.
| Acronym | Type | Description | Unit |
|---|---|---|---|
| P-duration | Parameter | P wave duration. Measured as the time interval between P-on and P-end. | ms |
| QRSi | Parameter | QRS complex duration. Measured as the time interval between QRS-on and QRS-end. | ms |
| T-duration | Parameter | T wave duration. Measured as the time interval between T-on and T-end. | ms |
| P-amplitude | Parameter | P wave amplitude. Measured as the amplitude difference between P-peak and P-end. | mV |
| Q-amplitude | Parameter | Q wave amplitude. Measured as the amplitude difference between Q-peak and baseline. | mV |
| R-amplitude | Parameter | R wave amplitude. Measured as the amplitude difference between R-peak and baseline. | mV |
| S-amplitude | Parameter | S wave amplitude. Measured as the amplitude difference between S-peak and baseline. | mV |
| QRS-amplitude | Parameter | QRS complex amplitude. Measured as the amplitude difference between R-peak and S-peak. | mV |
| T-amplitude | Parameter | T wave amplitude. Measured as the amplitude difference between T-peak and T-end. | mV |
| P-area | Parameter | P wave area. Measured as the integral of the P-wave between P-on and P-end. | µV.s |
| QRS-area | Parameter | QRS complex area. Measured as the integral of the QRS complex between QRS-on and QRS-end. | µV.s |
| T-area | Parameter | T wave area. Measured as the integral of the T-wave between T-on and T-end. | µV.s |
| P-Rs | Parameter | P-R segment. Measured as the mean amplitude between P-end and QRS-on. | mV |
| S-Ts | Parameter | S-T segment. Measured as the mean amplitude between QRS-end and T-on. | mV |
| P-Ri | Parameter | P-R interval. Measured as the time between the onset of the P-wave (P-on) to the onset of the QRS complex (QRS-on). | ms |
| Tp-e | Parameter | T peak-end interval. Measured as the time measured from the peak of the T wave (T-peak) to the end of the T wave (T-end). | ms |
| S-Ti | Parameter | S-T interval. Measured as the time interval between QRS-end and T-on. | ms |
| Q-Ti | Parameter | Q-T interval. Measured as the time between the onset of the QRS complex (QRS-on) to the end of the T-wave (T-end). | ms |
| Q-Tic | Parameter | Corrected Q-T interval (available with a choice of 7 correction formulas) | ms |
| J-Ti | Parameter | J-T interval. Measured as the time measured between QRS-end and T-end. | ms |
Related Articles
User authentication and permission management (UAP) module
The procedures described below outline the management of the additional user authentication and permission management (UAP) module, including: - General introduction. - User authentication and management. - User role and permission management. 1. ...Using LASA Excel exports and pivot tables
This guide supports you in the analysis of your physiological data (cardiac and respiratory) derived from LASA exports via Excel. The Excel export generated by the LASA software is a powerful tool for analyzing your cardio-respiratory physiological ...Data transfer feature management
The following article describes how to manage data transfer between an acquisition system and an analysis server (Local or CLOUD). Introduction and prerequisites about the feature Introduction and system configuration details: The data transfer ...Cloud managment and data transfer (lasa 2.17 and higher)
The following article describes how to manage data on the CLOUD interface. > Data on cloud interfaces deployed by ETISENSE remain the property of the customer and are hosted on a secure server. General introduction The Cloud is a remotely hosted ...Data analysis with LASA software (Last edition, Software version 2.16 and higher)
This article provides the key steps for data analysis with Lasa software and data export to Excel. The Excel file containing the physiological variables calculated for several animals studied can be used to draw initial conclusions or to prepare the ...